🔮 Maybe the Election Isn't as Close as You Think
Meet an underground election modeler betting that Harris is the clear favorite
If Carl Allen has one goal for this interview - and perhaps in life overall - it’s to convince you of something that might seem pedantic at first: polls are not predictions.
In his new book on polling, in Nate Silver’s Twitter mentions, and among political bettors where he has something of a cult following, Allen loves to skewer the modern polling-industrial complex, which boils down to the following critique:
It is impossible to make any useful prediction from polling data without layering on a set of judgment calls. Most important of these are:
Which way the undecideds and mind-changers will break;
Which polls to include in the model; and
How heavily to weight recent polls versus older ones
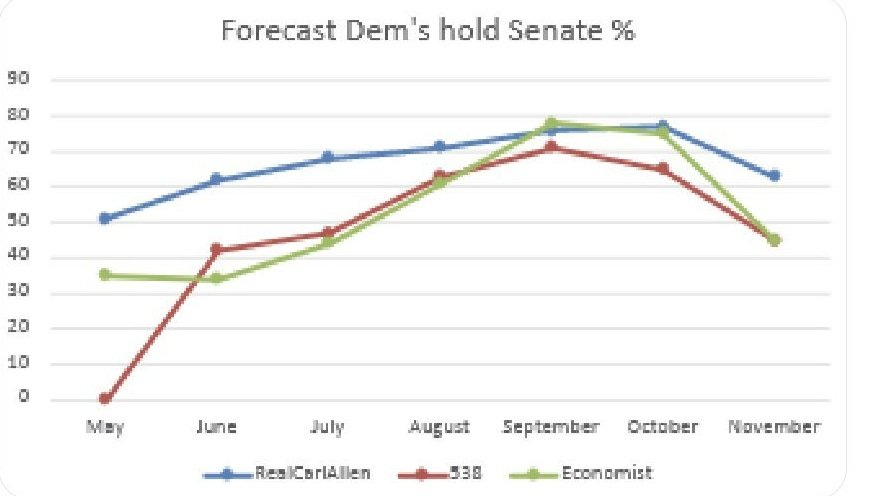
Allen, if you have not guessed by now, has “someone is wrong on the internet” energy, honed by years of arguing about polls in the posting trenches. Among political bettors, Allen is known for his out-of-consensus call for Democrats to narrowly hold the Senate in 2022. He credits this with other analysts’ incorrectly banking on a “midterm curse” (that a president’s party tends to lose seats at the midterms) and their reliance on polling averages which are now more polluted by partisan polls.
Allen’s forecasting began with casual election bets with friends, but soon expanded to producing formal models, which he publishes on Substack, and his new book, The Polls Weren’t Wrong, which is both an expanded critique of current election models and a guide to Allen’s methods.
The following interview with Allen is based on multiple conversations and edited for length. All answers are his own.
The Oracle: Ok, who’s going to win?
My forecast has Harris around 66% to win the election right now. I wouldn't be surprised to see her end closer to 60% or 80%. For her to be higher or lower than that, we'd need something on par with a "Comey moment."
I don't expect her to win easily, but it will be hard for her to fall behind in the blue wall, with her average hovering at or over 49% right now. And she does have some "outs" via North Carolina, Georgia, or even Arizona if the blue wall cracks. But that would be a long night.
With low undecideds and low third-party turnout, this election is a little easier to forecast. Not easy, just easier than it could be if Kennedy were still in the race.
The Oracle: I’m pointing a gun at your head. Do a map.
The most likely map is highly unlikely! Asking me to give my most likely map for the election is like asking me to give you the exact sum of 20 rolls of a six-sided die. The "most likely" answer is 70, but there would still be a 95% chance I'm wrong.
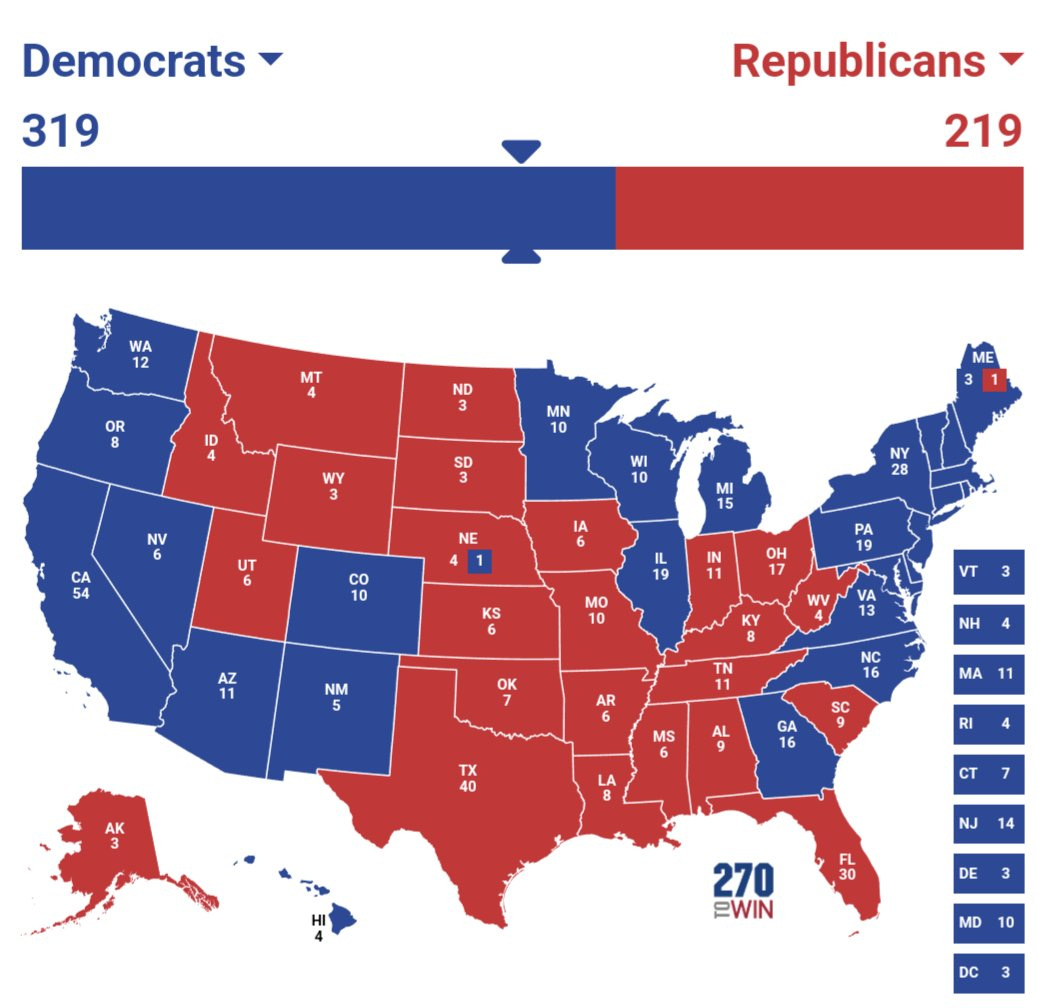
But - as long as it’s clear that this is not my “prediction” - and that the most likely map still only has a 5% probability according to my forecast, here goes:
A Harris win with 303 or 319 electoral votes are tied for the most likely scenario
276 and 289 are close 3rd and 4ths
292 was a surprising 5th
So overall my forecast has Harris ending with 303 Electoral Votes +/- about 80.
How does your model work and how is it different from the others?
I'll mention a couple major differences I'm pretty sure exist:
1) Recency bias
2) Allocation of undecideds
3) Removing "low quality" polls
First, recency bias. It makes sense that more recent polls should get more weight than older ones. But how much more? Is a couple days that significant?
Whenever possible, I use lots of polls and do not have significant weighting by recency. Popular aggregation methods decrease their weight somewhat linearly leading up to the election, such that a week-old poll is still included, but with far less weight than one done yesterday. That's better, but still misses a ton of value.
The problem, I think, is that forecasters are so paranoid about missing some "late movement" or "momentum" that they assign undue meaning to late polls. In poll data, fluctuation is normal and expected. A candidate's number going up or down two points is often absolutely meaningless.
Analysts are rational when polls do that a month before the election, but for whatever reason, when it happens a day before the election, their poll averages and forecasts zoom in that direction, as happened in the New Hampshire Senate race in 2022.
The Oracle: In this race you had a candidate swap late in the game. Do you include polls from when Biden was still in?
When the candidate swap happened, the forecast basically became a "generic ballot" one. Based on the polls from when Biden was the presumptive nominee, it wasn't too hard to see that there were a ton of "lean D undecideds," and a good number of "lean D" voters hiding out as Kennedy supporters, too.
I priced in a lot of those lean Ds coming home when Harris became the candidate, and we have lots of poll data now showing that they have, so my forecast has stayed relatively flat. No need to extrapolate from when Biden was on the ballot anymore.
The Oracle: How are you allocating the undecideds now?
To my knowledge, other American forecasters use "50-50 undecided" as the assumption, whereas I use polling and demographic data to estimate which way they will break.
When Biden was the candidate, I favored a 60-40 split of undecideds for Biden. Simply looking at past vote and voter preference supported that.
We have lots of good data about undecideds: some polls push hard for a lean, many others supply demographics. This is no different than how I treated my 2022 Senate forecast for Ohio, when Tim Ryan was "ahead" of Vance for most of the race in the polling averages, but I still had Vance as a pretty strong favorite. Now that it's Harris, and she's consolidated most of the support that I believed was "lean D" I now think it's more likely that the outstanding undecideds will slightly favor Trump. Disgruntled conservatives.
The reduced impact of undecideds is why it’s much more likely for a candidate to win when they consistently poll at or above 49% – because there are fewer undecideds out there who could break the other way. I’d much rather my candidate have a three-point lead at 49%-46% than a six-point “lead” in a 46%-40% race with more undecideds.
The Oracle: You advocate for excluding partisan polls from the averages. How do you know if a pollster is partisan or low quality?
Easy. If they aren't transparent with their methodology, and I can't see how they weighted their data, or even much about how they took their sample. I strongly disagree with the idea that a pollster's "accuracy" can offset questionable methodology.
The Oracle: When you look at the election odds, do any scenarios stand out as mispriced?
The easiest answer is Harris to win the election. It's a boring answer, but she's getting roughly even money and I think she should be a medium favorite.
Her position in the blue wall states is very strong. Candidates whose poll average is over 49% almost always win. I dread oversimplification, but with a proper understanding of poll data, we should expect this to be true. Even if the remaining undecideds favor Trump, he would need to get almost all of them.
Poll errors do exist - but even in the scenario that Harris' true support is overstated in those states, the likelihood she doesn't get at least some undecided support to make it up is low. Low does not equal zero, however, and time is a hell of a drug.
If you're looking for a more creative angle, picking the right electoral vote bin pays out pretty well. The two that stand out to me: Dems by 35-64 (🔮 10% odds), and 65-104 (🔮 15%).
But I'm not too proud to admit there's a chance my forecast is wrong. If you think it's wrong, you should be taking a few positions, I think:
1) Trump to win Wisconsin (🔮 44%). If the blue wall cracks, this is the best bet, in my opinion. Trump is only getting there 44% right now. Better payout than Trump 49% to win the election.
2) Trump to win Michigan (🔮 34%). I just forecasted the UK Elections, both mayoral and general, a few months ago. Down to the constituency, Arab-American voters who have traditionally voted a certain way simply did not "come home" as many believed they would. They voted third-party in large numbers.
Jill Stein might pull a real percentage in Michigan, at the direct expense of Harris. I'd be surprised if she didn't get 50,000 votes there, and not surprised if she got 100,000. Decisive difference - I don't know - but my forecast, which clearly thinks Harris has a better chance than most, only gives her 68% to win Michigan.
The Oracle: If either campaign calls you for advice, what would you tell them to do?
If I'm working for the Harris campaign, I'm doing more work in the Latino community, specifically attacking him for the "dictator on day one" talk. Hispanics are absolutely not a monolith, but I think everyone would respond negatively to that, and images of Maduro and Castro saying similar things to Trump would be powerful.
Also, I'm getting Tim Walz on a swing state small town tour to help change tires, visit diners, and talk to people.
If I'm working for the Trump campaign, I'm taking away his phone, not talking about Haitians or cat ladies anymore, and staying on message on a few points: fracking in Pennsylvania, Gaza in Michigan, and jobs jobs jobs. "No tax on tips" isn't the best policy in my opinion, but that doesn't matter, it's popular. Hit that in Nevada. His advantage is that swing voters view him as better for their wallet. Immigration, too, but that can be related to taxes - another area where he tends to be stronger. If he did more of that, he'd have a better chance I think.
Disclaimer
Nothing in The Oracle is financial, investment, legal or any other type of professional advice. Anything provided in any newsletter is for informational purposes only and is not meant to be an endorsement of any type of activity or any particular market or product. Terms of Service on polymarket.com prohibit US persons and persons from certain other jurisdictions from using Polymarket to trade, although data and information is viewable globally.


Highly recommend interviewing Captain Seth Keshel. Best election analysis on substack with 50K subs.
I hope everybody reads this guys piece because in the end it will only make me more money when Trump ends up winning.
The Problem with this guys model is that I don't see any mention of the low propensity voters that skew 3 to 1 for Trump and are seemingly coming out in droves.
Based on early vote data Republicans are doing far better in the early vote/vbm than in years past and Democrats are doing worse.
In the case of the Republicans it's not a case of them cannibalizing their election day vote either, it's low propensity, Trump or bust voters coming out early, which is huge for Trump.
You also have to factor in that nearly every single poll has a history of understating Trumps support, especially in the Rust Belt, which is why Kamalas own internals have her down in every swing state except for Michigan but as anyone who follows elections knows, the Rust Belt always votes together (Except 1988 when Dukakis won WI). So if Trump wins WI and PA the chances of him losing MI is very small.