

🔮 How Accurate is Polymarket?
Our quant speaks

🔮 The following is an interview with Alex McCullough, an NYC-based on-chain analyst who built a data dashboard for tracking the accuracy of Polymarket odds over time. Follow Alex on X.
The Oracle: Where did the idea come from?
I was looking to branch out in the industry and skill up a bit. I settled on learning data science, and then bridged over to learning Dune.
I enjoyed it, but got bored of doing basic DeFi metrics like transaction count, TVL, that type of thing. I've been in this space since 2016 and I remember the days of Auger and being fascinated with prediction markets. But nobody was using them back then. I would log in and there would be no markets open. Literally zero.
So then when Polymarket started getting traction, I was thinking, okay, now this has activity. But how accurate are these markets? On the surface, it makes sense that they would be accurate. But I'm always curious. Maybe there are some cases where it’s less accurate, like how people like betting on underdog sports teams.

The Oracle: So how accurate is Polymarket?
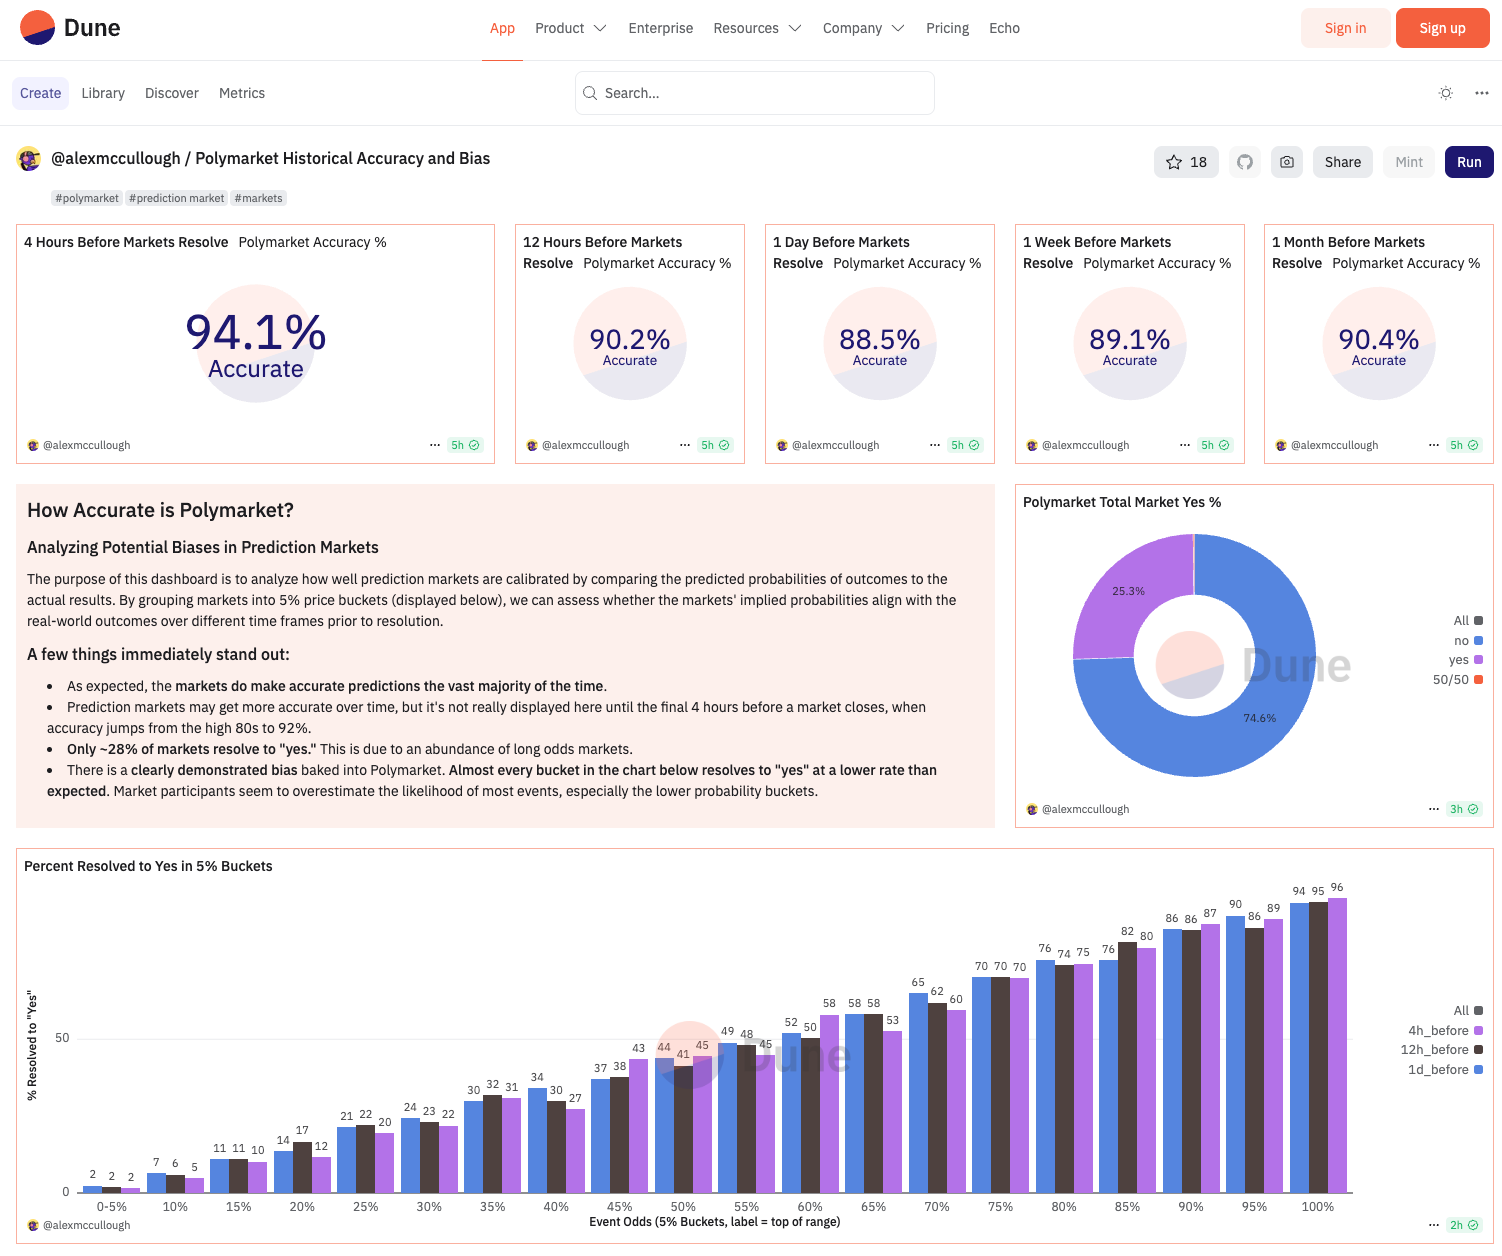
Polymarket is very accurate, over 90% accurate even a month before the markets close. The accuracy gets higher the closer you get to the market resolution, with a few exceptions that we can discuss.
The Oracle: When did you launch this?
October 30. I published it about a week before the election.
The Oracle: How do you measure accuracy?
In my dashboard, any market above 50% that resolves to “Yes” is counted as correct and any market below 50% that results in “No” is counted as correct. That overall accuracy is displayed in the top row, broken down by time to resolution.
The Oracle: How did you pick the timeframes?
I played with a bunch of different timeframes and settled on these because they showed the most interesting data. I found that four hours was the minimum you need, because markets don't resolve immediately. Sometimes it can take days between when the event happens and when the market resolves. That’s also why I eliminated a lot of the outliers in the charts at the bottom of the page; that removes markets where the outcome is known but haven’t resolved yet.

The Oracle: Can you give me an example of an outlier that you would remove?
At the bottom of the dashboard, I'm removing everything that's above 90% and below 10% because a lot of those markets have already ended, like a game that ends and everyone knows the outcome, but for some reason, the price gets stuck.
For example, if I'm watching the Celtics game, and I see that they win or lose, at that moment the market will stop trading on Polymarket. The outcome is known but then it has to go through the resolution process which is usually two hours but sometimes it can take up to four or more to close out. So it wouldn’t make sense to look at “accuracy” in those final four hours because the outcome is already known.
The Oracle: One thing I noticed is that the markets are 90.4% accurate a month out, but it drops to 88.5% one day out. Why are they more accurate further out than the day before?
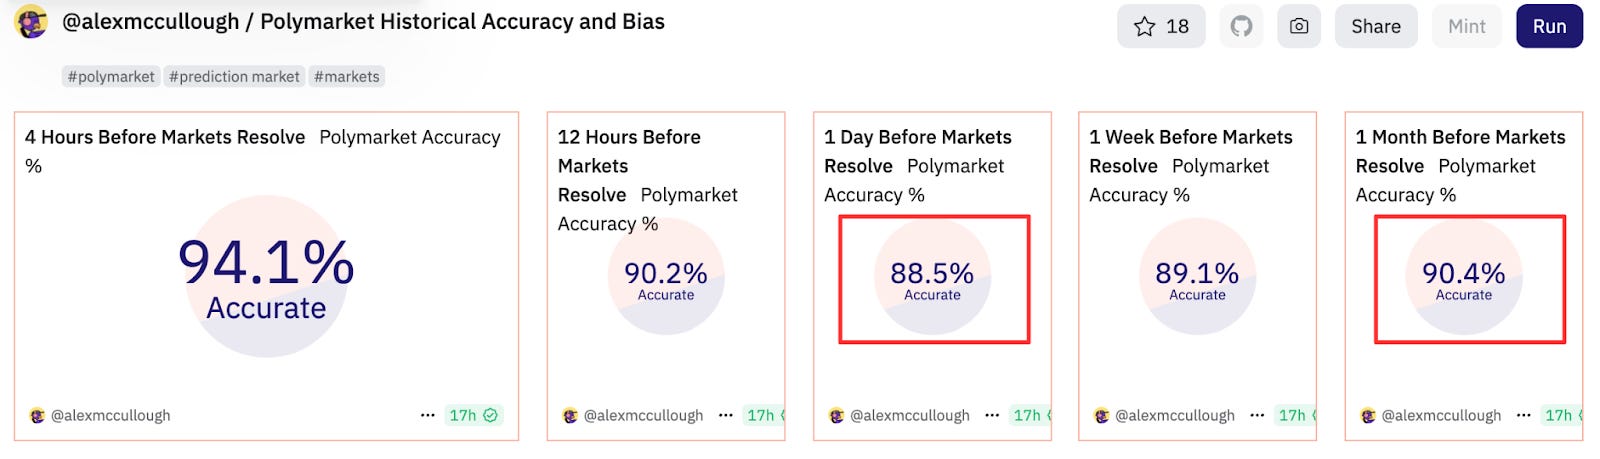
This has to do with the types of markets that stay open for longer time periods. The longer-term markets tend to have some options that are extreme locks as a “No” for example Gavin Newsom becoming president in the last election. Longer term markets tend to have more of these highly certain outcomes, which explains their higher accuracy as a group.

The Oracle: Is there anything else that stood out to you in the data?
The price buckets chart is pretty interesting - the orange and black bar charts in the middle. These compare the odds on Polymarket to the actual outcomes. For example, a market that shows 2% odds, does that event actually happen 2% of the time?

You can see that in general Polymarket tends to overestimate event probabilities, but just by a couple of points, and this effect is pretty constant all the way from 0 to 100% odds.
The Oracle: Do we know anything about how Polymarket’s accuracy breaks down by type of event? Or how it’s changing over time?
It would make sense that it’s getting more accurate over time, like with the efficient market hypothesis. But my current dashboard doesn’t look at this. I would love to have a lot more data, but the tables I used didn't have price data that granular.
Another issue I ran into was that Polymarket just doesn't have tons and tons of history, so I had to limit what I was able to analyze. For example, I tried to do only NFL games, and the data just looks ridiculous, because there's not that many NFL games in the history.
Connect With The Oracle
Tips? Feedback? Story ideas? Write oracle@polymarket.com or @wasabiboat on X
We’re On X: Follow The Oracle for updates
Write for The Oracle: We’re expanding our coverage and looking to hire more writers and investigators. Details Here.
Disclaimer
Nothing in The Oracle is financial, investment, legal or any other type of professional advice. Anything provided in any newsletter is for informational purposes only and is not meant to be an endorsement of any type of activity or any particular market or product. Terms of Service on polymarket.com prohibit US persons and persons from certain other jurisdictions from using Polymarket to trade, although data and information is viewable globally.
> In my dashboard, any market above 50% that resolves to “Yes” is counted as correct and any market below 50% that results in “No” is counted as correct.
...Why not use a Brier score? This is kind of a weirdly innumerate version of accuracy-tracking for a prediction market.
I mean simply being able to “Polymarket predicted X but question resolved to Y.” (instead of expressing that in terms of Brier score) feels easier most of the time.